
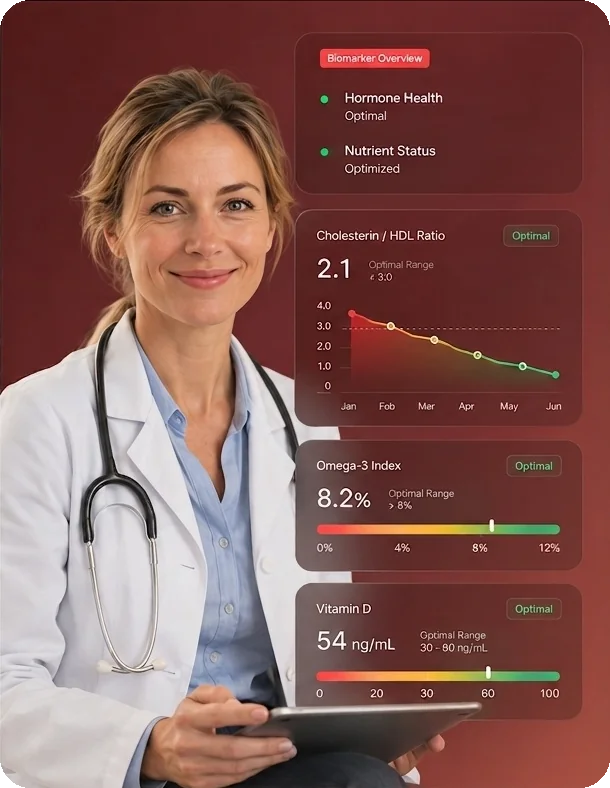
Subscription - test 2x or 4x per year
Core Health Blood Test
Basic panel of membership - 75+ biomarkers
Metabolic Health
Don't lose control of your metabolism as you age
Immune System Health
Catch silent inflammation in your body early
Organ Function
Protect your mobility and organ health ahead of time
Vitamins & Micronutrients
Avoid deficiencies and supplement with purpose
Your health is a system. The Core Health Blood Test analyzes 75+ biomarkers across four essential areas — metabolism, immune function, organ health, and micronutrients — to give you a complete picture of where you stand and where to improve. Included in every speak23 membership, taken 2× or 4× per year.
Metabolic Health
Immune Health
Organ Function
Micronutrients
Metabolic Health
Fasting Glucose
Your blood sugar after a stretch without food. One of the first markers to drift when the body starts working harder to handle glucose — a quiet early signal long before classic diabetes shows up, and one of the most actionable levers for long-term metabolic resilience.
HbA1c
Your average blood sugar over the past two to three months — a much steadier picture than any single reading. Keeping this in the lower half of the normal range is one of the most consistent patterns seen in people who age well, both physically and cognitively.
eAG
Translates your HbA1c into the everyday glucose unit you already know from fasting blood sugar. Think of it as the same information in plain language.
Total Cholesterol (TC)
The total cholesterol circulating in your blood. On its own it's a rough first impression — what really matters is how it breaks down into LDL, HDL, triglycerides, and the particle-based markers below.
LDL Cholesterol
Often called 'bad' cholesterol, LDL carries cholesterol out from the liver into circulation. Sustained high levels are one of the most studied drivers of arterial plaque — which is why keeping LDL low across decades is one of the clearest things you can do for a healthy cardiovascular span.
HDL Cholesterol
Often called 'good' cholesterol, HDL helps shuttle excess cholesterol back to the liver. Higher levels generally reflect a healthier cardiovascular picture, though the quality and function of HDL matters as much as the number itself.
Non-HDL Cholesterol
Captures all the cholesterol types that can build up in artery walls — LDL plus its relatives. It gives a more complete cardiovascular picture than LDL alone, especially when triglycerides are elevated.
Triglycerides
Fats in the blood that come from calories your body didn't immediately use. Persistently elevated triglycerides are one of the earliest fingerprints of insulin resistance and visceral fat — and respond beautifully to changes in diet, movement, and sleep.
Apolipoprotein B
Counts the actual number of atherogenic particles in your blood rather than just the cholesterol they carry. Modern cardiovascular research increasingly views ApoB as the single best lipid marker for long-term arterial health, especially when standard cholesterol looks normal but something feels off.
LDL/HDL ratio
Compares potentially harmful cholesterol to the protective kind — a quick read on which side of the balance is winning. The lower this ratio, the more your lipid environment favours long-term cardiovascular wellbeing.
TC/HDL ratio
A long-established risk indicator comparing total cholesterol with HDL. A lower number means HDL is doing more of the protective work — a quiet but meaningful contributor to a long heart-healthy life.
GGT/HDL ratio
Pairs a liver enzyme with protective cholesterol to give a combined read of liver and metabolic health. When elevated, it can be an early hint that the liver — often the silent driver of metabolic ageing — could use some attention.
Triglycerides/HDL ratio
The ratio between triglycerides and HDL — one of the most sensitive early signals of insulin resistance, often years before fasting glucose or HbA1c move. Catching it early is one of the highest-leverage things you can do for long-term metabolic health.
Immune Health
WBC
Counts all the white blood cells protecting you from infection and regulating inflammation. Persistently high or low values are worth exploring — chronic low-grade shifts here are one of the patterns linked to slower or faster biological ageing.
RBC
Counts the red blood cells that carry oxygen everywhere your body needs energy. Values outside the normal range can point to low iron stores, hydration shifts, or changes in how the bone marrow is producing cells.
RDW
Looks at how uniform your red blood cells are in size. Greater variation can be an early sign of nutritional strain — often iron, B12, or folate — sometimes appearing before haemoglobin itself drops.
Hemoglobin
The protein inside red blood cells that actually carries oxygen. Low haemoglobin defines anaemia and can show up as fatigue, breathlessness, or foggy thinking — often before levels become severely low.
Hematocrit
The proportion of your blood made up of red blood cells. A useful read on how well-oxygenated your blood is, and how the body is responding to changes in iron status or hydration.
Platelets (PLT)
Small cell fragments that rush to seal injuries and start clotting. Both very high and very low counts are worth knowing about — one tilts toward unwanted clotting, the other toward slower healing.
Mean Platelet Volume (MPV)
The average size of your platelets. Larger platelets tend to be more reactive, which can be relevant to clotting efficiency and is increasingly studied in the context of cardiovascular resilience.
MCV
The average size of your red blood cells, which helps reveal what type of nutritional shortfall might be at play. Smaller cells often point to iron, larger cells to B12 or folate.
MCH
The amount of haemoglobin carried inside each red blood cell — a useful detail when piecing together what's behind any change in red cell quality.
MCHC
The concentration of haemoglobin inside red blood cells. Together with MCV and MCH, it gives a precise read on red cell health.
CRP
A protein the body releases quickly when there's inflammation anywhere — from an infection, an injury, or quiet chronic stress. High-sensitivity CRP is one of the strongest predictors of long-term cardiovascular and metabolic health, and a level consistently below 1 mg/L is one of the markers most associated with healthy ageing.
ESR
How quickly red blood cells settle in a tube — a number that shifts when blood proteins rise during inflammation. A broad signal that the immune system may be working on something.
Systemic Immune Inflammation Index
A combined index of three immune cell types. When elevated, it suggests a higher overall level of immune activation — helpful context alongside other inflammation markers.
Morphology
A trained look at your blood cells under a microscope, picking up details no automated counter can — unusual cell shapes or subtle changes worth noting.
Segmented Neutrophils (abs.)
Your immune system's rapid-response cells, the first to react to bacterial threats. Their numbers tell you how ready the body is to mount a defence.
Segmented Neutrophils (%)
The share of your white blood cells that are neutrophils. A higher proportion often reflects an active immune response; a lower one can suggest a quieter or more depleted state.
Basophils (abs.)
A type of white blood cell involved in allergic reactions and inflammation. Elevated levels can sometimes accompany ongoing allergic activity or specific inflammatory patterns.
Basophils (%)
The share of basophils among your white blood cells. Small shifts here can occasionally reflect chronic allergen exposure or subtle changes in immune tone.
Eosinophils (abs.)
Immune cells involved in allergic responses and reactions to environmental triggers. Elevated counts can sometimes be linked to allergies, skin conditions, or food sensitivities.
Eosinophils (%)
The percentage of eosinophils among your white blood cells. Sustained elevation may be worth following up if you also notice allergy-type symptoms.
Lymphocytes (abs.)
The white blood cells of your adaptive immune system — the cells that remember past infections and produce antibodies. Low levels can reflect recent viral illness, stress, or longer-term immune strain.
Lymphocytes (%)
The proportion of lymphocytes among white blood cells. Shifts here are often a natural response to other immune activity rather than a concern on their own.
Monocytes (abs.)
Monocytes — white blood cells that travel into tissues to clear up damage and debris. They play an underappreciated role in regulating inflammation and immune resilience.
Monocytes (%)
The share of monocytes among white blood cells. Elevated proportions can sometimes accompany ongoing immune activity or recovery from illness.
Neutrophil/Lymphocyte ratio
The neutrophil-to-lymphocyte ratio — comparing the inflammatory front line with the adaptive defence. When elevated, it points to a more inflammatory immune state, and is increasingly studied as a low-cost marker of biological ageing.
Platelet/Lymphocyte ratio
Compares platelet activity to adaptive immune cells. When elevated, it can reflect a heightened inflammatory tone — useful context for assessing overall immune balance.
MPV/PLT ratio
Combines platelet size and count into a single signal. Adds insight into how reactive the clotting system currently is.
Organ Function
AST (GOT)
An enzyme found in both liver and muscle that's released when these tissues are under stress. Elevated levels suggest the liver or muscles are working harder than usual — best interpreted alongside ALT.
ALT (GPT)
The most liver-specific enzyme in this panel. A persistently elevated ALT is one of the earliest reliable signals that the liver — increasingly recognised as a central organ in metabolic ageing — is under strain.
AST/ALT ratio
The relationship between two liver enzymes that adds context to any elevation. Different patterns can point toward different sources of strain on the liver.
GGT
One of the most sensitive liver enzymes — quick to rise with alcohol, certain medications, or fat accumulation in the liver. It often shifts long before any structural changes appear, making it valuable as an early-warning marker.
Alkaline Phosphatase (ALP)
An enzyme found in liver, bone, and bile ducts. When elevated, it can reflect activity in any one of these areas — most informative alongside other liver and bone markers.
Bilirubin
A yellow pigment produced when red blood cells are broken down and processed by the liver. Small amounts are normal — higher levels reflect how efficiently the liver is clearing these waste products.
Albumin
The most abundant protein in your blood, made by the liver. It carries nutrients and keeps fluids in the right compartments. Drops can reflect reduced liver production or low nutritional intake over time.
Index FIB-4
A non-invasive score combining age, liver enzymes, and platelets to estimate liver health. A practical way to track whether the liver is staying in good shape across the years.
Creatinine
A waste product from normal muscle activity that the kidneys filter out. When creatinine rises, it usually means the kidneys are filtering less efficiently — one of the clearest early signals of kidney strain.
BUN
Reflects how your body is processing protein and how well the kidneys are clearing waste. Shifts can come from protein intake, hydration, or kidney efficiency itself.
BUN/Creatinine ratio
The ratio between two kidney and metabolism markers, adding context to why either might be elevated — for example, whether the cause is dehydration or a change in kidney filtration.
eGFR
Estimates how efficiently your kidneys are filtering blood, adjusted for age and sex. Protecting kidney function over time is one of the quieter pillars of healthy ageing — the kidneys influence blood pressure, mineral balance, and how the body handles almost everything else.
Urea
The end product of protein breakdown, cleared by the kidneys. Elevations can reflect a high-protein diet, increased muscle turnover, or kidneys filtering less efficiently.
Uric Acid
A natural byproduct of breaking down certain foods. Persistently high levels can be linked to joint discomfort and metabolic shifts — particularly relevant with diets rich in red meat, alcohol, or fructose.
Lipase
An enzyme from the pancreas that helps digest fats. Significant elevations can signal that the pancreas has been under acute stress.
Pancreatic Amylase
Another digestive enzyme from the pancreas, focused on carbohydrates. Elevated alongside lipase, it adds context about pancreatic function.
CK
An enzyme released when muscle tissue is under stress. It naturally rises after intense exercise — but persistent elevation without an obvious cause is worth exploring.
LDH
Found in almost every tissue, LDH is released when cells are under stress. A non-specific marker, but a useful general signal when something is placing unusual load on the body.
Calcium-Phosphate product
The combined level of two key minerals — calcium and phosphate. Higher values can reflect shifts in mineral balance that matter for bone and kidney health over the long term.
Micronutrients
Vitamin D (25-OH-D3)
The main form of vitamin D in your blood, built from sunlight and food. It supports bone strength, immune function, mood, and cellular health more broadly. Low levels are extremely common in modern indoor living, and optimising vitamin D is one of the simplest, best-supported moves for long-term resilience.
Vitamin B12
Essential for healthy nerves, red blood cell production, and DNA repair. B12 only comes from animal foods or supplements — making this an important marker for anyone eating plant-based, anyone over 50, or anyone on long-term reflux medication. Low levels can quietly chip away at energy and cognition.
Magnesium
Involved in hundreds of processes — from making energy to relaxing muscles, regulating sleep, and stabilising heart rhythm. Magnesium is widely depleted in modern diets, and even mild shortfalls are linked to fatigue, poor sleep, and muscle tension.
Iron
The mineral at the heart of oxygen delivery to every muscle, organ, and brain cell. Low iron often shows up as tiredness, reduced stamina, and difficulty concentrating — sometimes long before other markers shift.
Ferritin
Your body's iron storage protein — the single most sensitive indicator of whether iron reserves are full. Low ferritin is the earliest sign of depletion; elevated ferritin can also reflect inflammation, which is why it's read in context.
Transferrin
The protein that carries iron through the blood to where it's needed. When stores run low, the body produces more transferrin — an early sign it's reaching for its reserves.
Transferrin Saturation
Shows what percentage of the iron-transport protein is actually loaded with iron. Low saturation confirms not enough iron is reaching cells; high saturation can suggest iron is building up.
TIBC (Total Iron-Binding Capacity)
The maximum amount of iron your blood could carry. A high TIBC means the transport system has spare capacity — often because there isn't enough iron available to fill it.
UIBC (Unsaturated Iron Binding Capacity)
The portion of the iron-transport protein currently unoccupied. High UIBC supports the picture of low available iron and complements the other iron markers.
Serum Osmolarity
How concentrated your blood is — reflecting the balance of water, salts, and dissolved substances. Shifts can come from hydration, salt intake, or other metabolic factors.
Sodium (Na+)
The main mineral regulating fluid balance, blood pressure, and nerve signalling. Both too much and too little sodium can affect energy, blood pressure, and how you feel day to day.
Potassium (K+)
Works closely with sodium to maintain fluid balance and support muscle and heart function. Levels largely reflect diet — consistently low potassium can drive fatigue and muscle cramps, and higher dietary potassium is one of the patterns linked to lower long-term blood pressure.
Na+/K+ ratio
The balance between two key electrolytes. Diets high in processed food and low in vegetables often shift this ratio — and a sustained imbalance has been linked to blood pressure changes over time.
Chloride (Cl-)
Works alongside sodium to maintain fluid balance and acid-base stability. Chloride shifts usually mirror changes in sodium or kidney function.
Calcium (Ca2+)
Known for bone strength, calcium is also essential for muscle contraction, nerve signalling, and a steady heart rhythm. Blood levels are tightly regulated — shifts often reflect how vitamin D and parathyroid hormone are managing calcium behind the scenes.
Phosphate
Partners with calcium in bone structure and energy production. Phosphate levels are tied to kidney function and vitamin D metabolism — a useful marker for overall mineral balance.
Cl-/Na+ ratio
A derived marker that helps read your body's acid-base balance. Small shifts add context when other electrolyte markers are also moving.